Connect your historian to the tools you trust
Bring your historian data into spreadsheets, dashboards, code and AI assistants with the same context and definitions wherever your teams work.
Your historian, wherever your teams work
Capture context once. Access your data from Excel, Grafana, code and AI assistants with consistent definitions across your workflows. Explore the integrations below to see how Factorian brings industrial data into everyday analysis.
Excel Add-In
Live queries, batch and event tables, and refreshable workbooks instead of stale CSV exports.
Grafana Plugin
Batch overlays, phase timelines and alarm markers on zero-code dashboards.
MCP server & AI chat
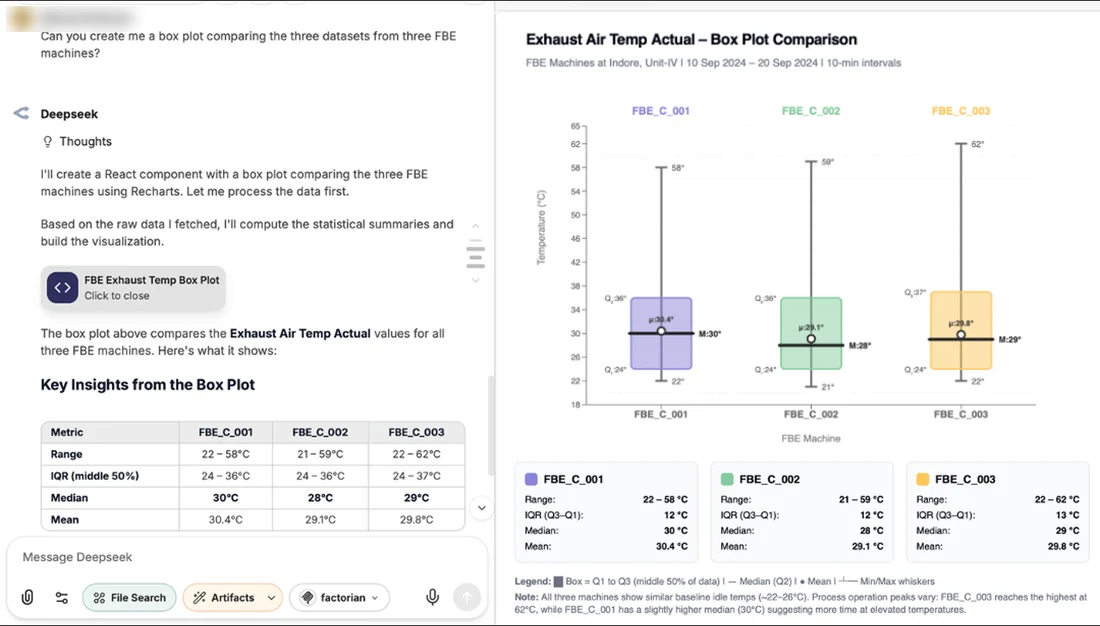
Ask plain-language questions about batches, SPC, PCA and maintenance. A local chatbot keeps data on-premise.
Open interfaces
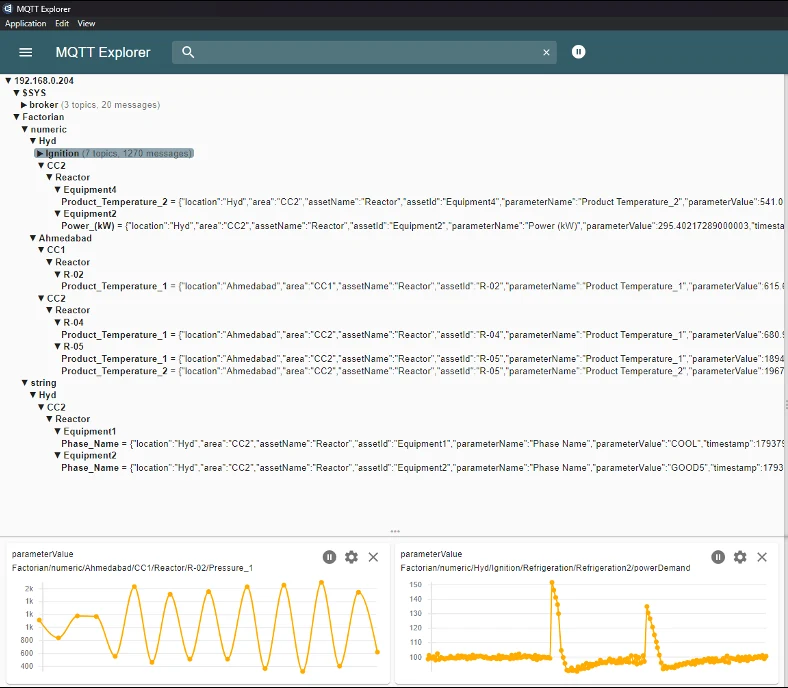
Read-only REST API (HTTPS) and MQTT for MES and BI, plus Python library, Streamlit, Node-RED, MATLAB and cloud connectors. Data can be exported for migration at any time.